
The Non-Dues Revenue Shift: Five Years of Data Point to a New Playbook
By Tamara Perry-Lunardo • November 4, 2026
Associations have named non-dues revenue their top challenge four years running, according to Naylor’s 2026 Association Benchmarking Report. That probably doesn’t surprise you; you’ve likely felt it in your own budget planning. But what caught my attention when our team lined up five years of that data side by side was that the challenge itself has changed shape. What was once a capacity problem is now a strategic one.
The Five-Year Arc
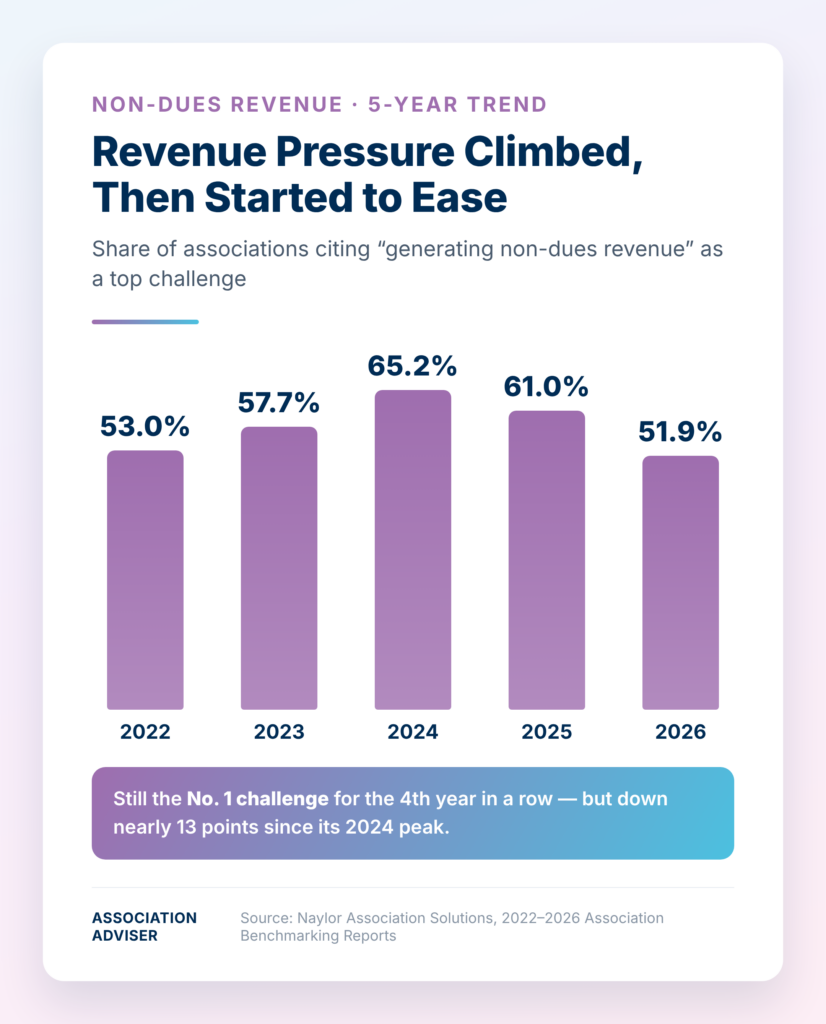
The share of associations citing non-dues revenue as a major challenge has moved in an arc: 53.0 percent in 2022, 57.7 percent in 2023, a peak of 65.2 percent in 2024, then back down to 61.0 percent in 2025 and 51.9 percent in 2026. The intensity has eased for two straight years even as the challenge keeps its No. 1 ranking.
Staffing, by contrast, didn’t follow that arc. The share of associations describing themselves as understaffed overall held almost flat, between 50 and 51 percent, from 2022 through 2025. It only broke from that pattern in 2026, dropping sharply to 35.1 percent, the first real staffing relief in five years of data.
It’s tempting to read the two trends as mirror images, and in 2026 they did ease together. But revenue anxiety peaked in 2024 while staffing pressure sat at its usual level. For most of this stretch, revenue concern moved on its own.
Why Is the Pressure Around Non-Dues Revenue Changing Shape?
The answer is in the barriers associations cite. Being understaffed and having limited resources, long the top two reasons associations struggle to grow non-dues revenue, have both eased noticeably: understaffing as a barrier dropped from 55.2 percent in 2023 to 46.8 percent in 2026, and limited resources fell from 54.6 percent to 45.4 percent over the same period.
The barrier replacing them is harder to fix with a new hire. Member and sponsor hesitancy toward financial commitments has climbed steadily, from 22.7 percent in 2023 to 34.1 percent in 2026, the biggest increase of any barrier we track. New for 2026, more than a quarter of associations point to poor integration between sponsorship and advertising offerings and a lack of data to demonstrate sponsor return on investment as constraints. Under-monetized member communications showed up as a named obstacle for the first time as well.
Sponsors are asking harder questions, and answering them means proving value, packaging offers coherently across channels, and treating revenue generation as a connected commercial strategy rather than three or four separate sales efforts running in parallel.
A More Diversified Revenue Mix
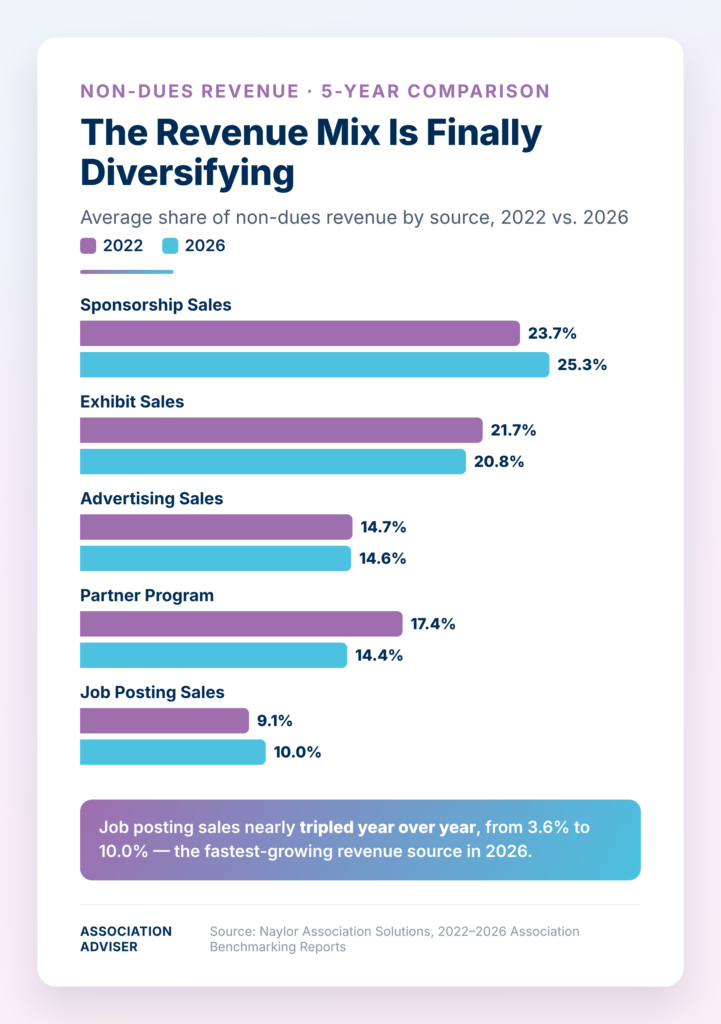
The revenue mix itself backs this up. In 2022, sponsorship sales and exhibit sales together accounted for nearly half of the average association’s non-dues revenue, at 23.7 percent and 21.7 percent respectively, while job posting sales were an afterthought at 9.1 percent. By 2026, sponsorship’s share had slipped to 25.3 percent, down from 29.7 percent just the year before, while job posting sales nearly tripled year over year, from 3.6 percent to 10.0 percent, climbing back above their 2022 share. Advertising sales and partner programs both grew as well, to 14.6 percent and 14.4 percent respectively. The 2026 mix is the most evenly distributed the report has recorded in recent years, which means a soft year in any one category is easier to absorb.
What Should Associations Do About It?
So what do you do with this as you head into 2027 planning? Here’s where I’d start. First, close the loop between the sponsor satisfaction surveys most associations already run (more than three in four do so annually, according to the 2026 report) and the ROI data those sponsors are asking for. You probably have most of that information already; it just isn’t packaged yet into the kind of reporting that keeps renewal conversations easy.
Second, stop treating job postings, advertising, and partner programs as minor line items relative to sponsorship and exhibit sales. The fastest growth in 2026 came from exactly those categories, and associations that build real sales processes and packaging around them stand to gain the most ground.
Third, plan for continued hesitancy from financial supporters rather than waiting for it to fade. Flexible, tiered packaging—something short of fully customized but more than a rigid take-it-or-leave-it bundle—matches where most associations already say they’re headed.
Finally, resist the instinct to solve this with headcount alone. Staffing relief this year is good news, and the extra capacity will help. But the barriers growing fastest now, like sponsor hesitancy and thin ROI data, aren’t staffing problems. They call for better packaging and clearer proof of value. Put that new capacity toward the three strategies above.
Non-dues revenue is still the first challenge associations name, but the way they describe it is changing. “We don’t have the people” is hard to fix. “We need to prove our value” is something associations can work on right now, often with data they already have. Where will your team start?
Next week, we’ll examine trends in another top association concern, according to the 2026 Benchmarking Report: communicating member value.
Source: Naylor Association Solutions’ 2022–2026 Association Benchmarking Reports.

About the Author
Tamára Perry-Lunardo is Vice President of Content Services at Naylor, where she combines her strengths as a communicator, leader, and business strategist to deliver innovative, revenue-driving content solutions to clients and serves as Editor-in-Chief of Naylor’s Association Adviser media brand. Reach her at [email protected] or connect with her on LinkedIn.
Photo courtesy of Prachova Nataliia/Shutterstock.com.
Quick Takes
Associations naming non-dues revenue a top challenge peaked at 65.2% in 2024, then eased to 51.9% in 2026.
The classic capacity barriers—understaffing and limited resources—both eased several points since 2023.
New barriers took their place: sponsor hesitancy, poor sponsorship-advertising integration, and thin sponsor ROI data.
The revenue mix diversified. Sponsorship’s share slipped from 29.7% to 25.3% in a single year, while job posting sales nearly tripled.
Staffing eased sharply in 2026, down to 35.1% understaffed, after holding near 51% for four straight years.